File:SH SunspotNumbers.png
From Kook Science
Size of this preview: 800 × 485 pixels. Other resolution: 1,000 × 606 pixels.
Original file (1,000 × 606 pixels, file size: 55 KB, MIME type: image/png)
Summary
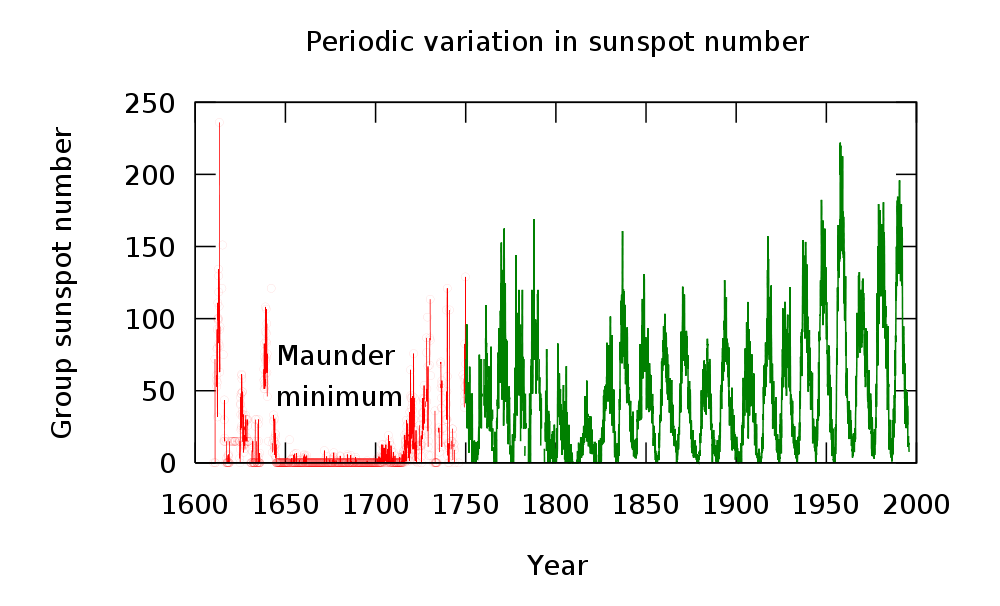
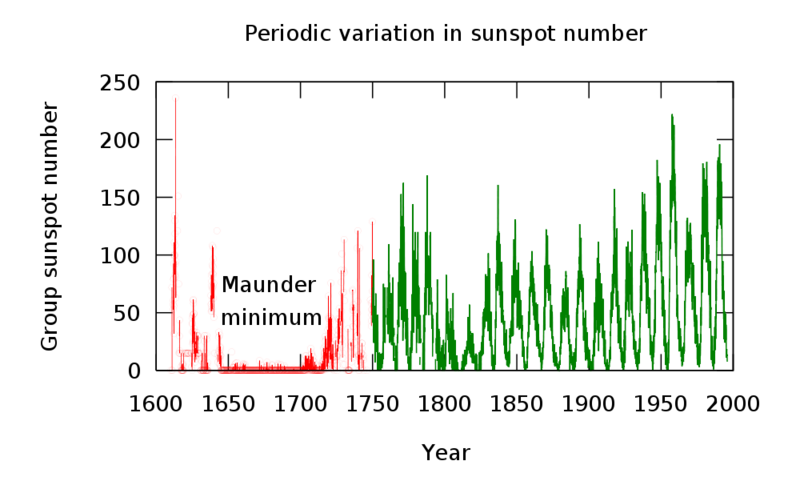
| Description | Numbers of sunspots since 1610.[1][2] Several periodic cycles are evident, most notably the 11 year (131 ± 14 month) cycle. The green line represents continuous monthly averages reported by the Solar Influences Data Center since 1749. The red data points represent sporadic observations since 1610. |
|---|---|
| Source | |
| Date |
2008-08-01 |
| Author | |
| Permission |
See below. |
Licensing
 | Permission is granted to copy, distribute and/or modify this document under the terms of the GNU Free Documentation License, Version 1.2 or any later version published by the Free Software Foundation; with no Invariant Sections, no Front-Cover Texts, and no Back-Cover Texts. |
| This work is licensed under the Creative Commons Attribution-ShareAlike 3.0 License. |
File history
Click on a date/time to view the file as it appeared at that time.
| Date/Time | Thumbnail | Dimensions | User | Comment | |
|---|---|---|---|---|---|
| current | 18:29, 22 September 2011 | | 1,000 × 606 (55 KB) | Imhezok (talk | contribs) | {{Information |Description= Numbers of sunspots since 1610.<ref name='Hoyt-Schatten_a'> {{cite journal|title=Group sunspot numbers: A new solar activity reconstruction. Part 1|journal=Solar Physics|date=1998|first=D.V.|last=Hoyt|coauthors=K.H. Schatten|vo |
You cannot overwrite this file.
File usage
The following page uses this file: